


wardley-beta engine allows strategy teams, architects, and product managers to map market environments using pure text. By positioning technical components across a 2D coordinate space, teams can visually analyze value chain dependencies, spot market inertia, and make structured build vs. buy choices.
Understanding the Coordinate Grid System
Unlike standard free-form flowcharts, every component in a Wardley Map is plotted onto a rigid two-dimensional space based on two decimal coordinates ranging from0.0 to 1.0:
- Visibility (Y-Axis / First Coordinate): Measures how visible or valuable a component is to an end-user. A value of
1.0represents a direct, user-facing touchpoint (highest visibility), while0.0represents hidden foundational infrastructure. - Evolution (X-Axis / Second Coordinate): Measures the maturity level of a market asset. It shifts left-to-right across four distinct evolutionary phases: Genesis (0.0), Custom-Built (0.25), Product/Rental (0.5), and Commodity/Utility (0.75 to 1.0).
Basic Syntax Structure
Every diagram begins with thewardley-beta declaration header. You then establish user anchors with the anchor keyword, map out operational infrastructure blocks with the component keyword, and draw relationships between them using directional arrows.
Mermaid
Edit Mermaid in VPasCode
wardley-beta
title Simple Strategy Map
anchor Customer [0.9, 0.5]
component Website [0.7, 0.4]
Customer -> Website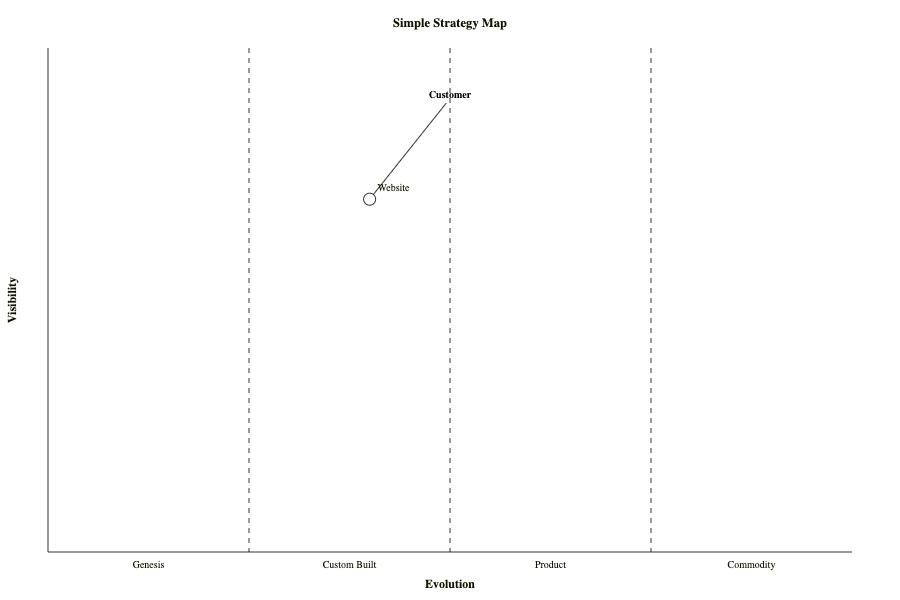
Syntax Reference
The table below breaks down the primary semantic building blocks and parameters required to structure a Wardley Map inside the Mermaid core interpreter.| Syntax Component | Type Requirement | Description & Usage Rules |
|---|---|---|
| Declaration | Keyword Identifier | Initializes the strategic grid mapping canvas. Must use the exact wardley-beta block string. |
| Title | Plain/Quoted String | An optional heading printed centered at the very top of the diagram grid workspace. |
| Size Bounds | Bracketed Pixels | An optional custom parameter used to override the default canvas width and height layout grid: size [1200, 700]. |
| Anchor Node | Keyword + Labels | Establishes the core user or buyer at the top of your value chain matrix. Requires coordinate bounds: anchor Buyer [Y, X]. |
| Component Node | Keyword + Labels | Declares an independent technical feature or asset block. Requires exact position bounds: component Core API [Y, X]. |
| Link Paths | Connection Operator | Draws direct, structured dependencies downward or horizontally through nodes via the -> syntax rule. |
Strategic Action Markers (Build, Buy, Outsource, Market)
To explicitly document strategic execution plans, Mermaid.js permits appending action wrappers to individual components. These actions place distinct shapes onto the coordinate node to convey architectural choices instantly:| Action Modifier | Rendered Shape Icon | Strategic Intent Mapping |
|---|---|---|
(build) |
Triangle Marker | Component is unique, high-risk, or crafted internally for competitive differentiation. |
(buy) |
Diamond Marker | Component is sourced or licensed from a third-party product vendor. |
(outsource) |
Square Marker | Component management is delegated fully to an external vendor pool. |
(market) |
Circle Marker | Component is a widely available utility or public commodity. |
Syntax Implementation Example:
Mermaid
Edit Mermaid in VPasCode
wardley-beta
component Custom UI [0.80, 0.30] (build)
component Payment Processor [0.45, 0.65] (buy)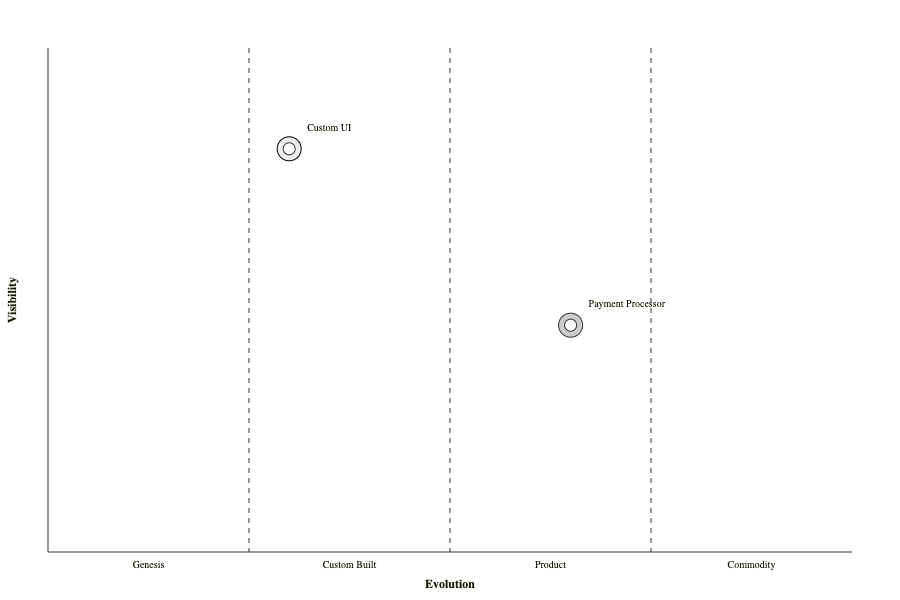
Real-World Blueprint: Artisan Coffee Shop Value Chain
This comprehensive blueprint tracks an expanding storefront business model. It outlines a full map architecture—configuring a larger custom size bound, establishing business anchors, setting specialized build/buy markers, and charting dependency links across axes phases.
Mermaid
Edit Mermaid in VPasCode
wardley-beta
title "Cafe Business Strategy Map"
size [1100, 650]

%% Core Business Anchors
anchor Franchise Owner [0.95, 0.55]
anchor End Customer [0.90, 0.65]

%% Operational Component Layers
component Specialty Coffee [0.75, 0.45] (build)
component Point of Sale Terminal [0.60, 0.60] (buy)
component Automated Hot Water [0.45, 0.75] (market)
component Electrical Grid Power [0.15, 0.90] (outsource)

%% Dependency Chain Linking Paths
End Customer -> Specialty Coffee
Franchise Owner -> Point of Sale Terminal
Specialty Coffee -> Automated Hot Water
Point of Sale Terminal -> Electrical Grid Power
Automated Hot Water -> Electrical Grid Power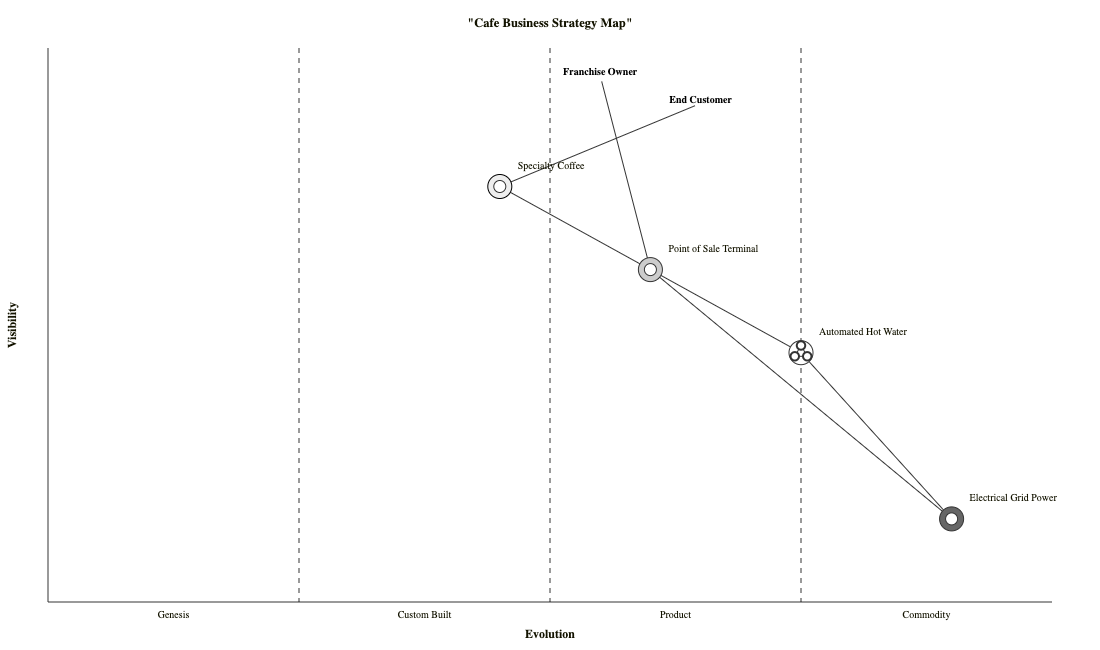
Syntax Tip: When declaring coordinate arrays, remember that the vertical Y-axis value (Visibility) comes *first*, and the horizontal X-axis value (Evolution) comes *second*
[Visibility, Evolution]. Reversing these positions is the single most common cause of components grouping incorrectly along the bottom edge of your map canvas.
Common Syntax Pitfalls & System Constraints
When compiling value chain spaces, keep these three layout boundaries in mind to ensure your text renders cleanly:- Strict Coordinate Ranges: Positions must sit precisely inside decimal brackets between
0.0and1.0. Using absolute integer pixels (like[400, 200]) instead of layout ratios inside node arguments will trigger a system execution error. - Declaration Order for Links: For clean layout rendering, ensure all your
anchorandcomponentlabels are declared and assigned coordinates *before* writing any node relationship lines (A -> B). Linking to an undeclared label can break map axis positioning. - Label Space Enclosures: If a component name contains spaces, symbols, or commas, make sure it is written accurately. Reusing mismatched string names inside connection paths will create an entirely new, unpositioned node on the grid canvas.