


The Mechanics of Graph Charts
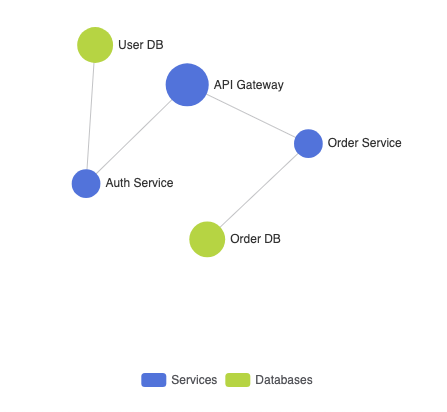
In Apache ECharts, graph charts usetype: 'graph'. Instead of mapping numeric values directly to horizontal and vertical axis coordinates, a graph chart takes a collection of explicit nodes (or data) and links (or edges). ECharts then arranges these nodes using fixed coordinate placements, circular layouts, or a dynamic force-directed physics engine.
1. Essential Setup
To build a basic network graph using force-directed physics, declare your nodes insidedata, map connections inside links, and set layout: 'force':
ECharts
Edit ECharts in VPasCode
option = {
    tooltip: {},
    legend: {
        data: ['Services', 'Databases']
    },
    series: [
        {
            name: 'System Network',
            type: 'graph',
            layout: 'force',
            roam: true, // Allows zooming and panning
            label: {
                show: true,
                position: 'right'
            },
            force: {
                repulsion: 100,
                edgeLength: 80
            },
            data: [
                { id: '0', name: 'API Gateway', symbolSize: 30, category: 0 },
                { id: '1', name: 'Auth Service', symbolSize: 20, category: 0 },
                { id: '2', name: 'Order Service', symbolSize: 20, category: 0 },
                { id: '3', name: 'User DB', symbolSize: 25, category: 1 },
                { id: '4', name: 'Order DB', symbolSize: 25, category: 1 }
            ],
            links: [
                { source: '0', target: '1' },
                { source: '0', target: '2' },
                { source: '1', target: '3' },
                { source: '2', target: '4' }
            ],
            categories: [
                { name: 'Services' },
                { name: 'Databases' }
            ]
        }
    ]
};
Advanced Structural Techniques
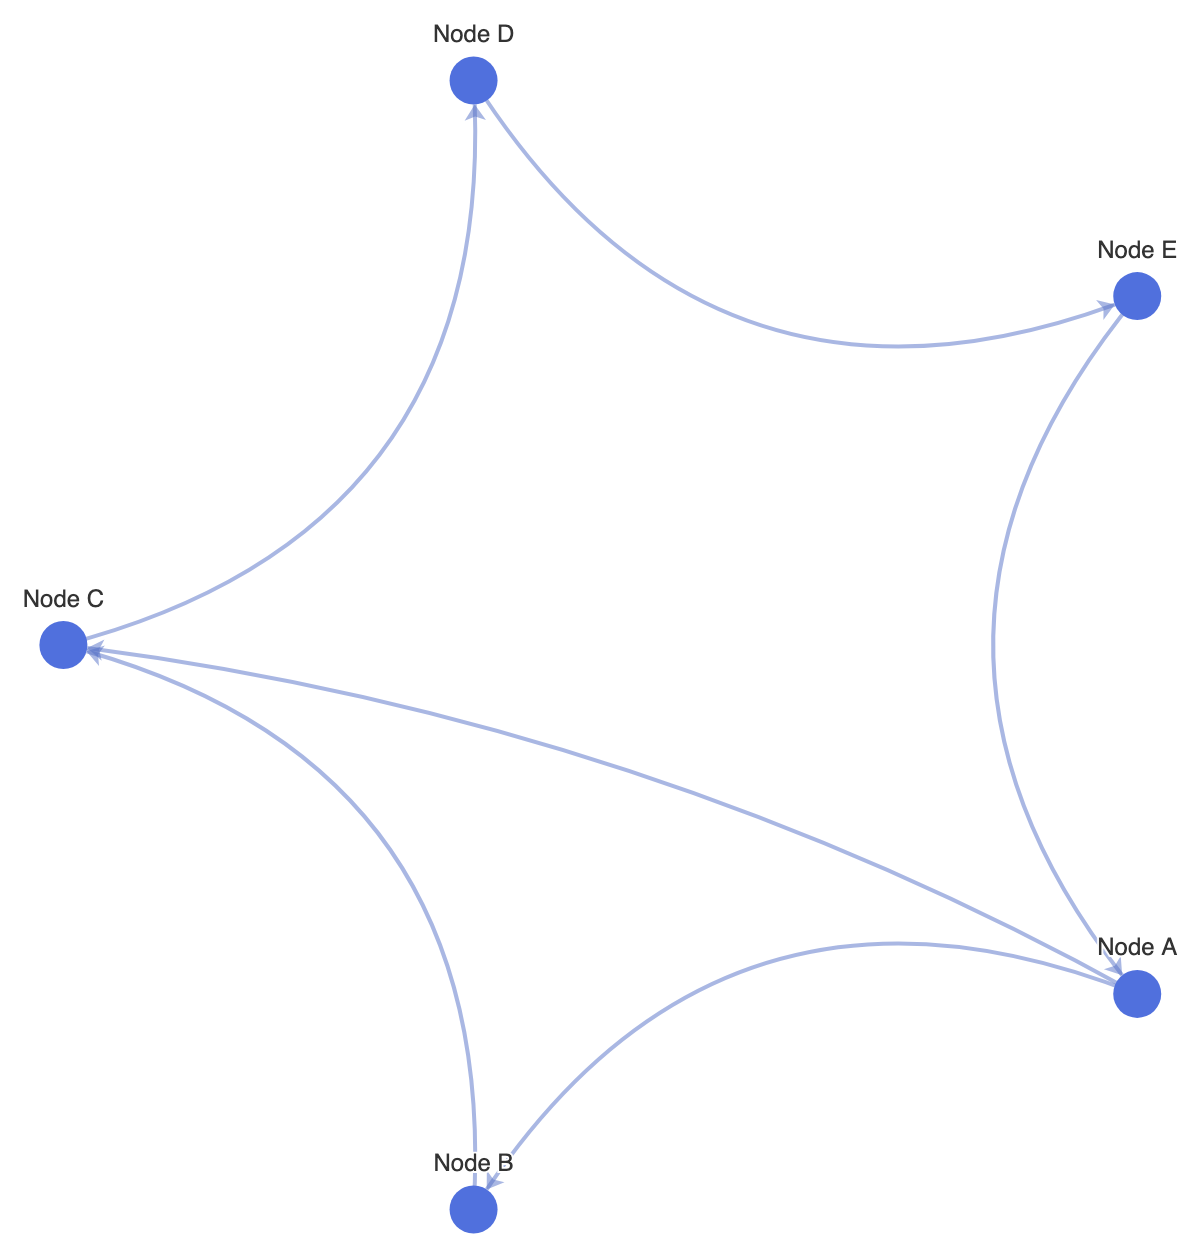
Graph charts support alternative layout engines like circular ring alignment or directed arrows to show data dependencies clearly.1. Circular Layout with Directed Link Arrows
Setlayout: 'circular' to organize nodes in a clean ring structure, and enable edge arrows to show directional relationships between components:
ECharts
Edit ECharts in VPasCode
option = {
    tooltip: {},
    series: [
        {
            type: 'graph',
            layout: 'circular',
            roam: true,
            label: {
                show: true,
                position: 'outside'
            },
            edgeSymbol: ['none', 'arrow'], // Draw arrows on link endpoints
            edgeSymbolSize: [0, 8],
            data: [
                { id: 'A', name: 'Node A', symbolSize: 24 },
                { id: 'B', name: 'Node B', symbolSize: 24 },
                { id: 'C', name: 'Node C', symbolSize: 24 },
                { id: 'D', name: 'Node D', symbolSize: 24 },
                { id: 'E', name: 'Node E', symbolSize: 24 }
            ],
            links: [
                { source: 'A', target: 'B' },
                { source: 'B', target: 'C' },
                { source: 'C', target: 'D' },
                { source: 'D', target: 'E' },
                { source: 'E', target: 'A' },
                { source: 'A', target: 'C' }
            ],
            lineStyle: {
                color: '#5470c6',
                width: 2,
                curveness: 0.2 // Curve connection lines to avoid overlap
            }
        }
    ]
};
Fine-Tuning Layout and Node Styling
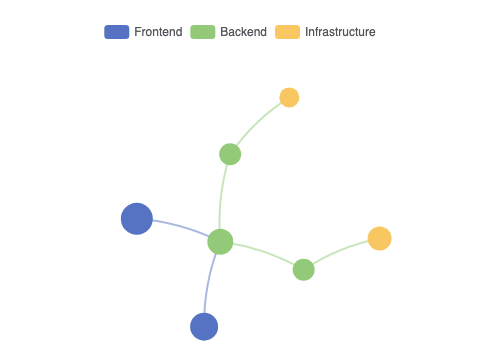
Adjusting edge curvature, node border shadows, and interaction options keeps dense network clusters readable on interactive web pages.1. Custom Node Category Colors and Force Physics
Tweak repulsion values and line styles to create structured, visually separated clusters:
ECharts
Edit ECharts in VPasCode
option = {
    legend: {
        top: '5%',
        left: 'center'
    },
    series: [
        {
            type: 'graph',
            layout: 'force',
            roam: true,
            draggable: true,
            force: {
                repulsion: 250,
                gravity: 0.1,
                edgeLength: [50, 100]
            },
            categories: [
                { name: 'Frontend', itemStyle: { color: '#5470c6' } },
                { name: 'Backend', itemStyle: { color: '#91cc75' } },
                { name: 'Infrastructure', itemStyle: { color: '#fac858' } }
            ],
            data: [
                { name: 'Web App', category: 0, symbolSize: 32 },
                { name: 'Mobile App', category: 0, symbolSize: 28 },
                { name: 'API Gateway', category: 1, symbolSize: 26 },
                { name: 'Microservice A', category: 1, symbolSize: 22 },
                { name: 'Microservice B', category: 1, symbolSize: 22 },
                { name: 'Redis Cache', category: 2, symbolSize: 20 },
                { name: 'PostgreSQL', category: 2, symbolSize: 24 }
            ],
            links: [
                { source: 'Web App', target: 'API Gateway' },
                { source: 'Mobile App', target: 'API Gateway' },
                { source: 'API Gateway', target: 'Microservice A' },
                { source: 'API Gateway', target: 'Microservice B' },
                { source: 'Microservice A', target: 'Redis Cache' },
                { source: 'Microservice B', target: 'PostgreSQL' }
            ],
            lineStyle: {
                color: 'source', // Color edge based on source node color
                width: 2,
                curveness: 0.1
            }
        }
    ]
};
Strategic Best Practices
- Enable
roam: truefor Navigation: Interactive networks grow quickly. Enabling zoom and pan navigation lets users focus on specific clusters without feeling cramped. - Apply
curvenessto Edges: Setting a slight curvature (e.g.,lineStyle.curveness: 0.1to0.2) prevents bidirectional links between two identical nodes from overlapping into a single line. - Balance Force Physics Repulsion: Tune
force.repulsioncarefully. Values that are too low will cause nodes to overlap into a dense cluster, while values that are too high will push nodes completely off the visible canvas.