


The Mechanics of Sankey Charts
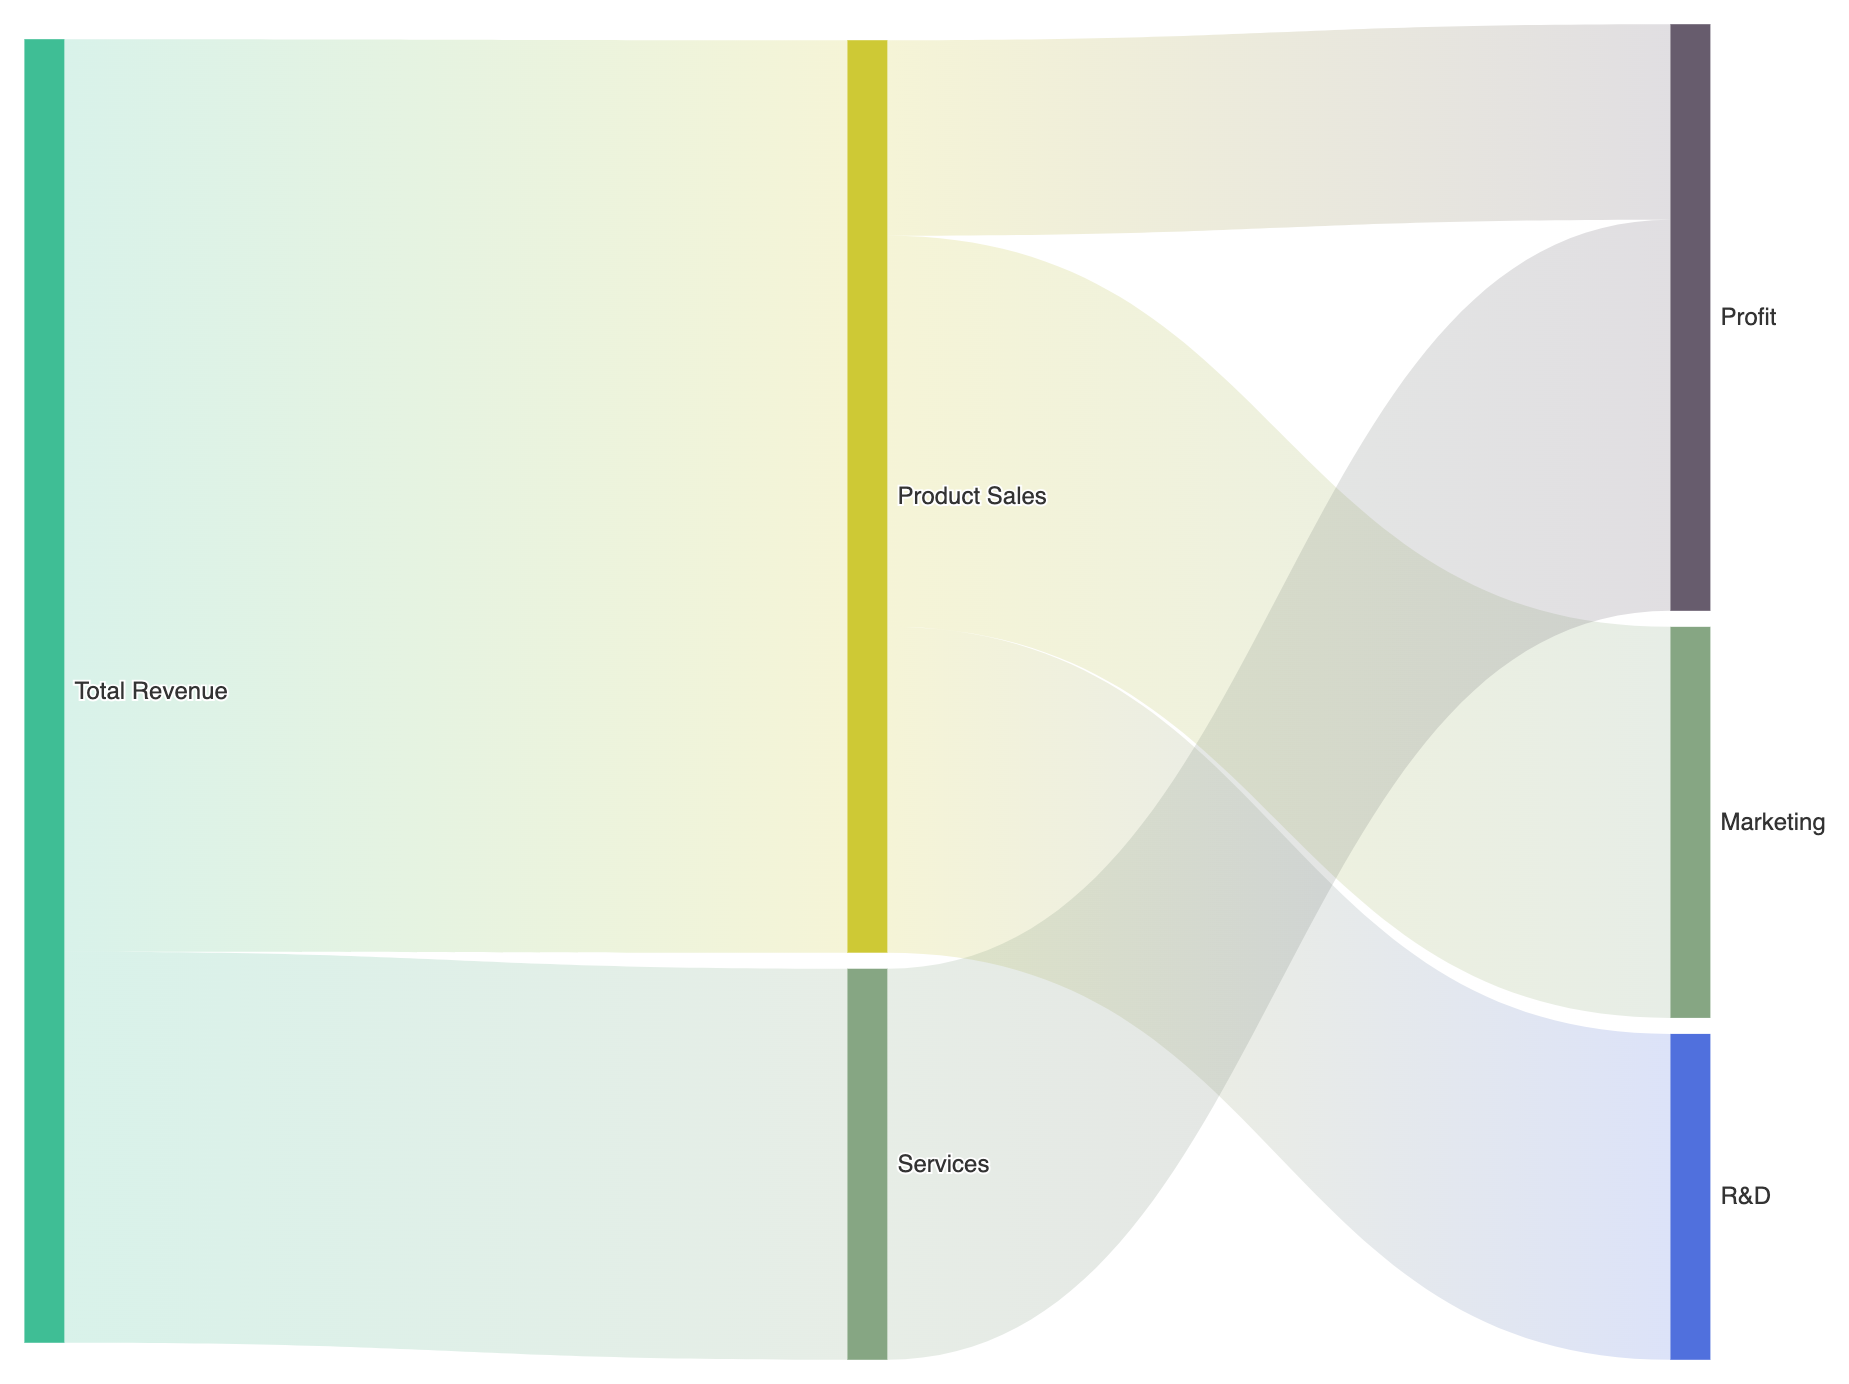
In Apache ECharts, Sankey charts usetype: 'sankey'. Similar to graph charts, a Sankey plot is defined by a list of distinct nodes (or data) and directed links (or edges). Each link contains a source node name, a target node name, and a numeric value that determines the visual width of the connecting flow line.
1. Essential Setup
To construct a basic Sankey chart, declare your node items insidedata and define directed flow volumes in links:
ECharts
Edit ECharts in VPasCode
option = {
    tooltip: {
        trigger: 'item',
        triggerOn: 'mousemove'
    },
    series: [
        {
            type: 'sankey',
            data: [
                { name: 'Total Revenue' },
                { name: 'Product Sales' },
                { name: 'Services' },
                { name: 'Marketing' },
                { name: 'R&D' },
                { name: 'Profit' }
            ],
            links: [
                { source: 'Total Revenue', target: 'Product Sales', value: 70 },
                { source: 'Total Revenue', target: 'Services', value: 30 },
                { source: 'Product Sales', target: 'Marketing', value: 30 },
                { source: 'Product Sales', target: 'R&D', value: 25 },
                { source: 'Product Sales', target: 'Profit', value: 15 },
                { source: 'Services', target: 'Profit', value: 30 }
            ],
            emphasis: {
                focus: 'adjacency'
            },
            lineStyle: {
                color: 'gradient',
                curveness: 0.5
            }
        }
    ]
};
Advanced Structural Techniques
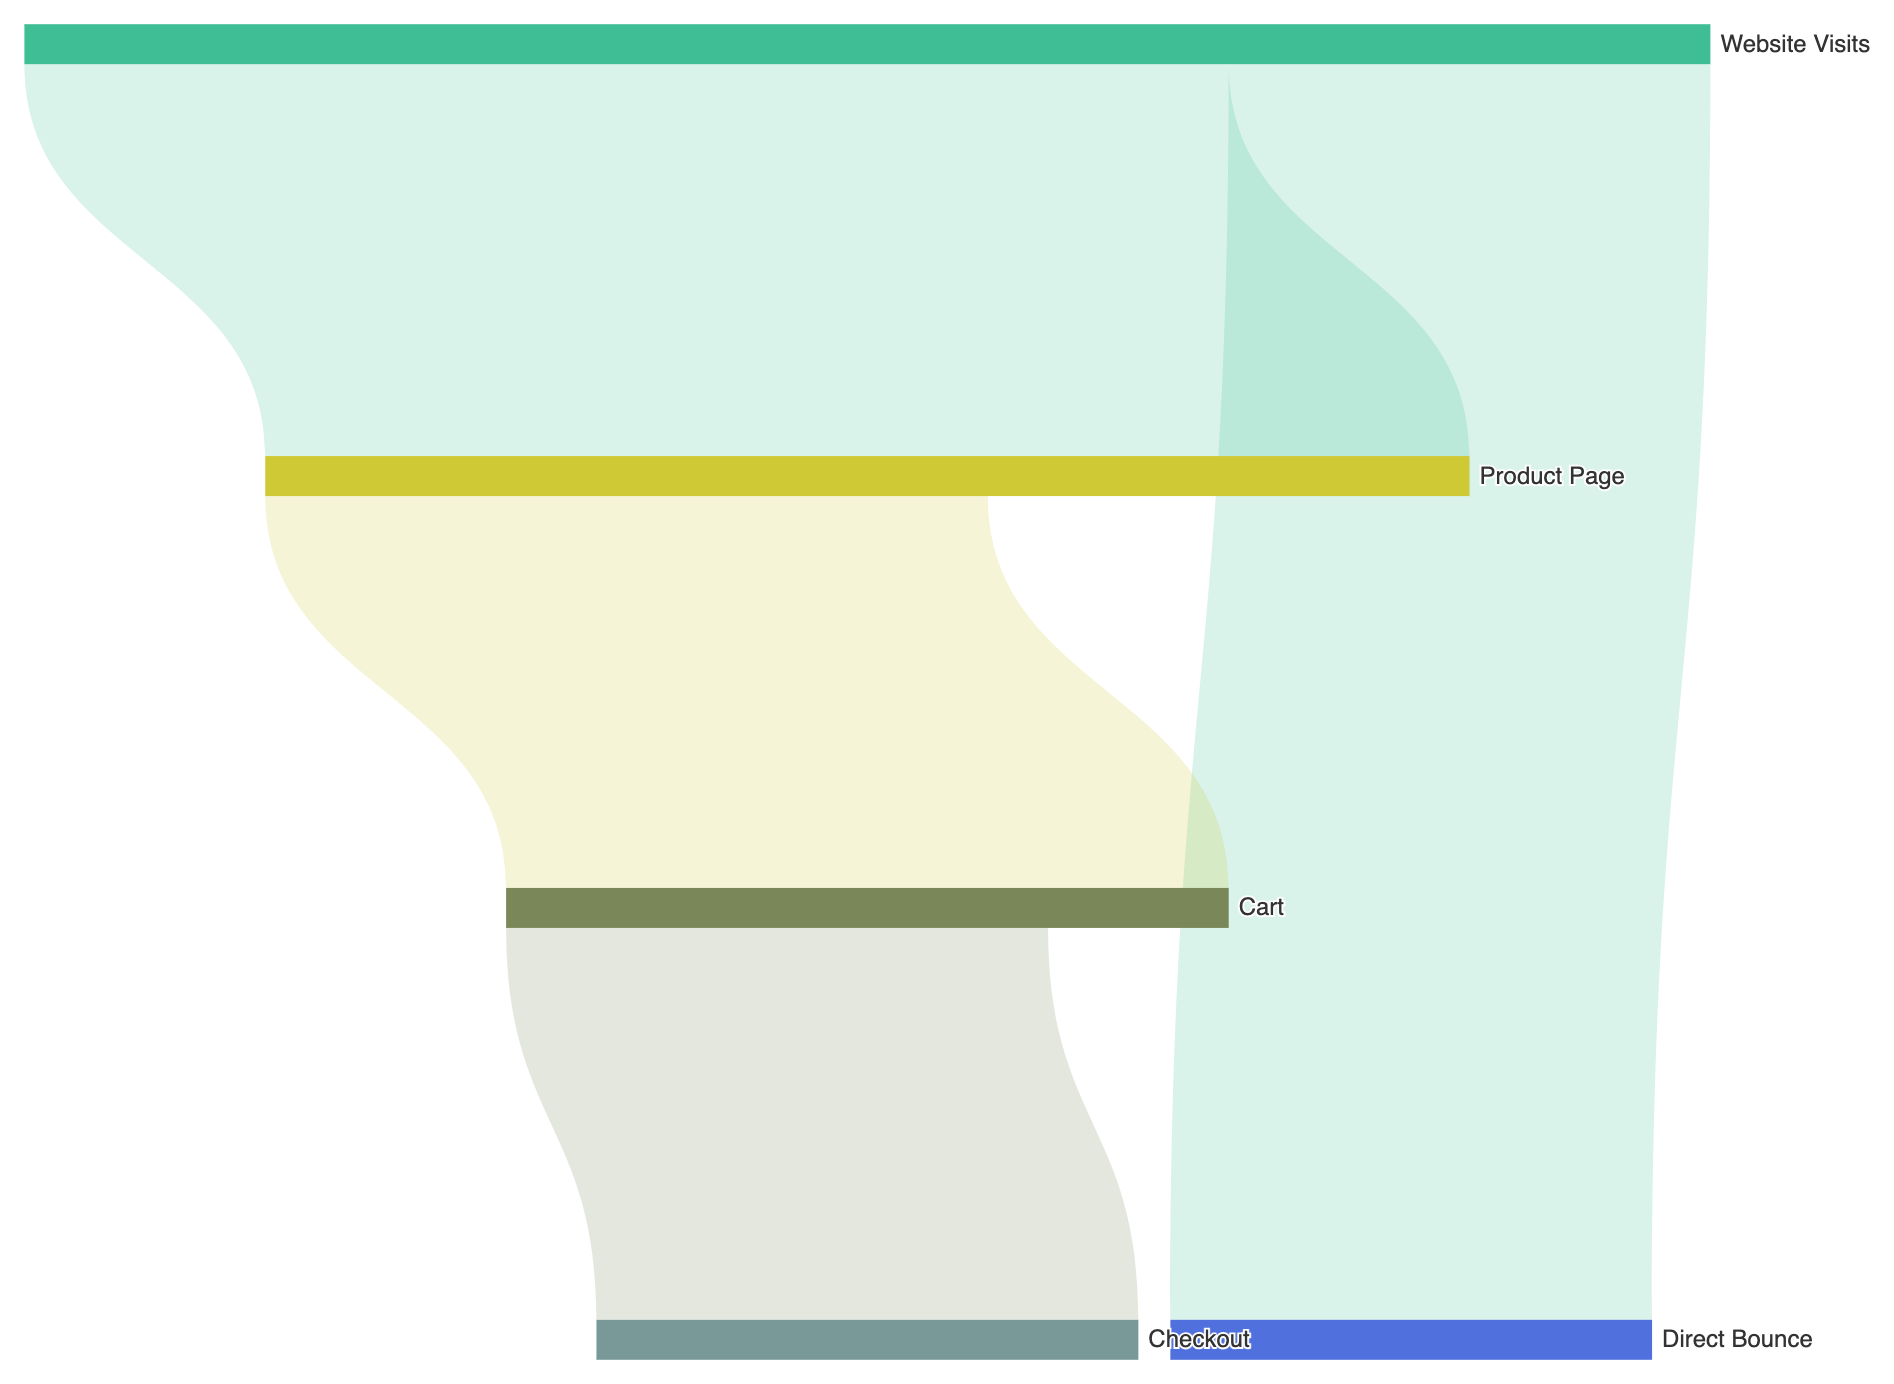
Sankey charts can be customized with vertical flow orientations, multi-level node colors, and dynamic link highlighting to trace individual paths through intricate networks.1. Vertical Flow Orientation
Setorient: 'vertical' to transform horizontal stage flows into a top-to-bottom vertical waterfall view:
ECharts
Edit ECharts in VPasCode
option = {
    tooltip: {
        trigger: 'item',
        triggerOn: 'mousemove'
    },
    series: [
        {
            type: 'sankey',
            orient: 'vertical',
            nodeWidth: 20,
            nodeGap: 16,
            data: [
                { name: 'Website Visits' },
                { name: 'Product Page' },
                { name: 'Direct Bounce' },
                { name: 'Cart' },
                { name: 'Checkout' }
            ],
            links: [
                { source: 'Website Visits', target: 'Product Page', value: 1000 },
                { source: 'Website Visits', target: 'Direct Bounce', value: 400 },
                { source: 'Product Page', target: 'Cart', value: 600 },
                { source: 'Cart', target: 'Checkout', value: 450 }
            ],
            lineStyle: {
                color: 'source',
                curveness: 0.5
            }
        }
    ]
};
Fine-Tuning Layout and Link Styling
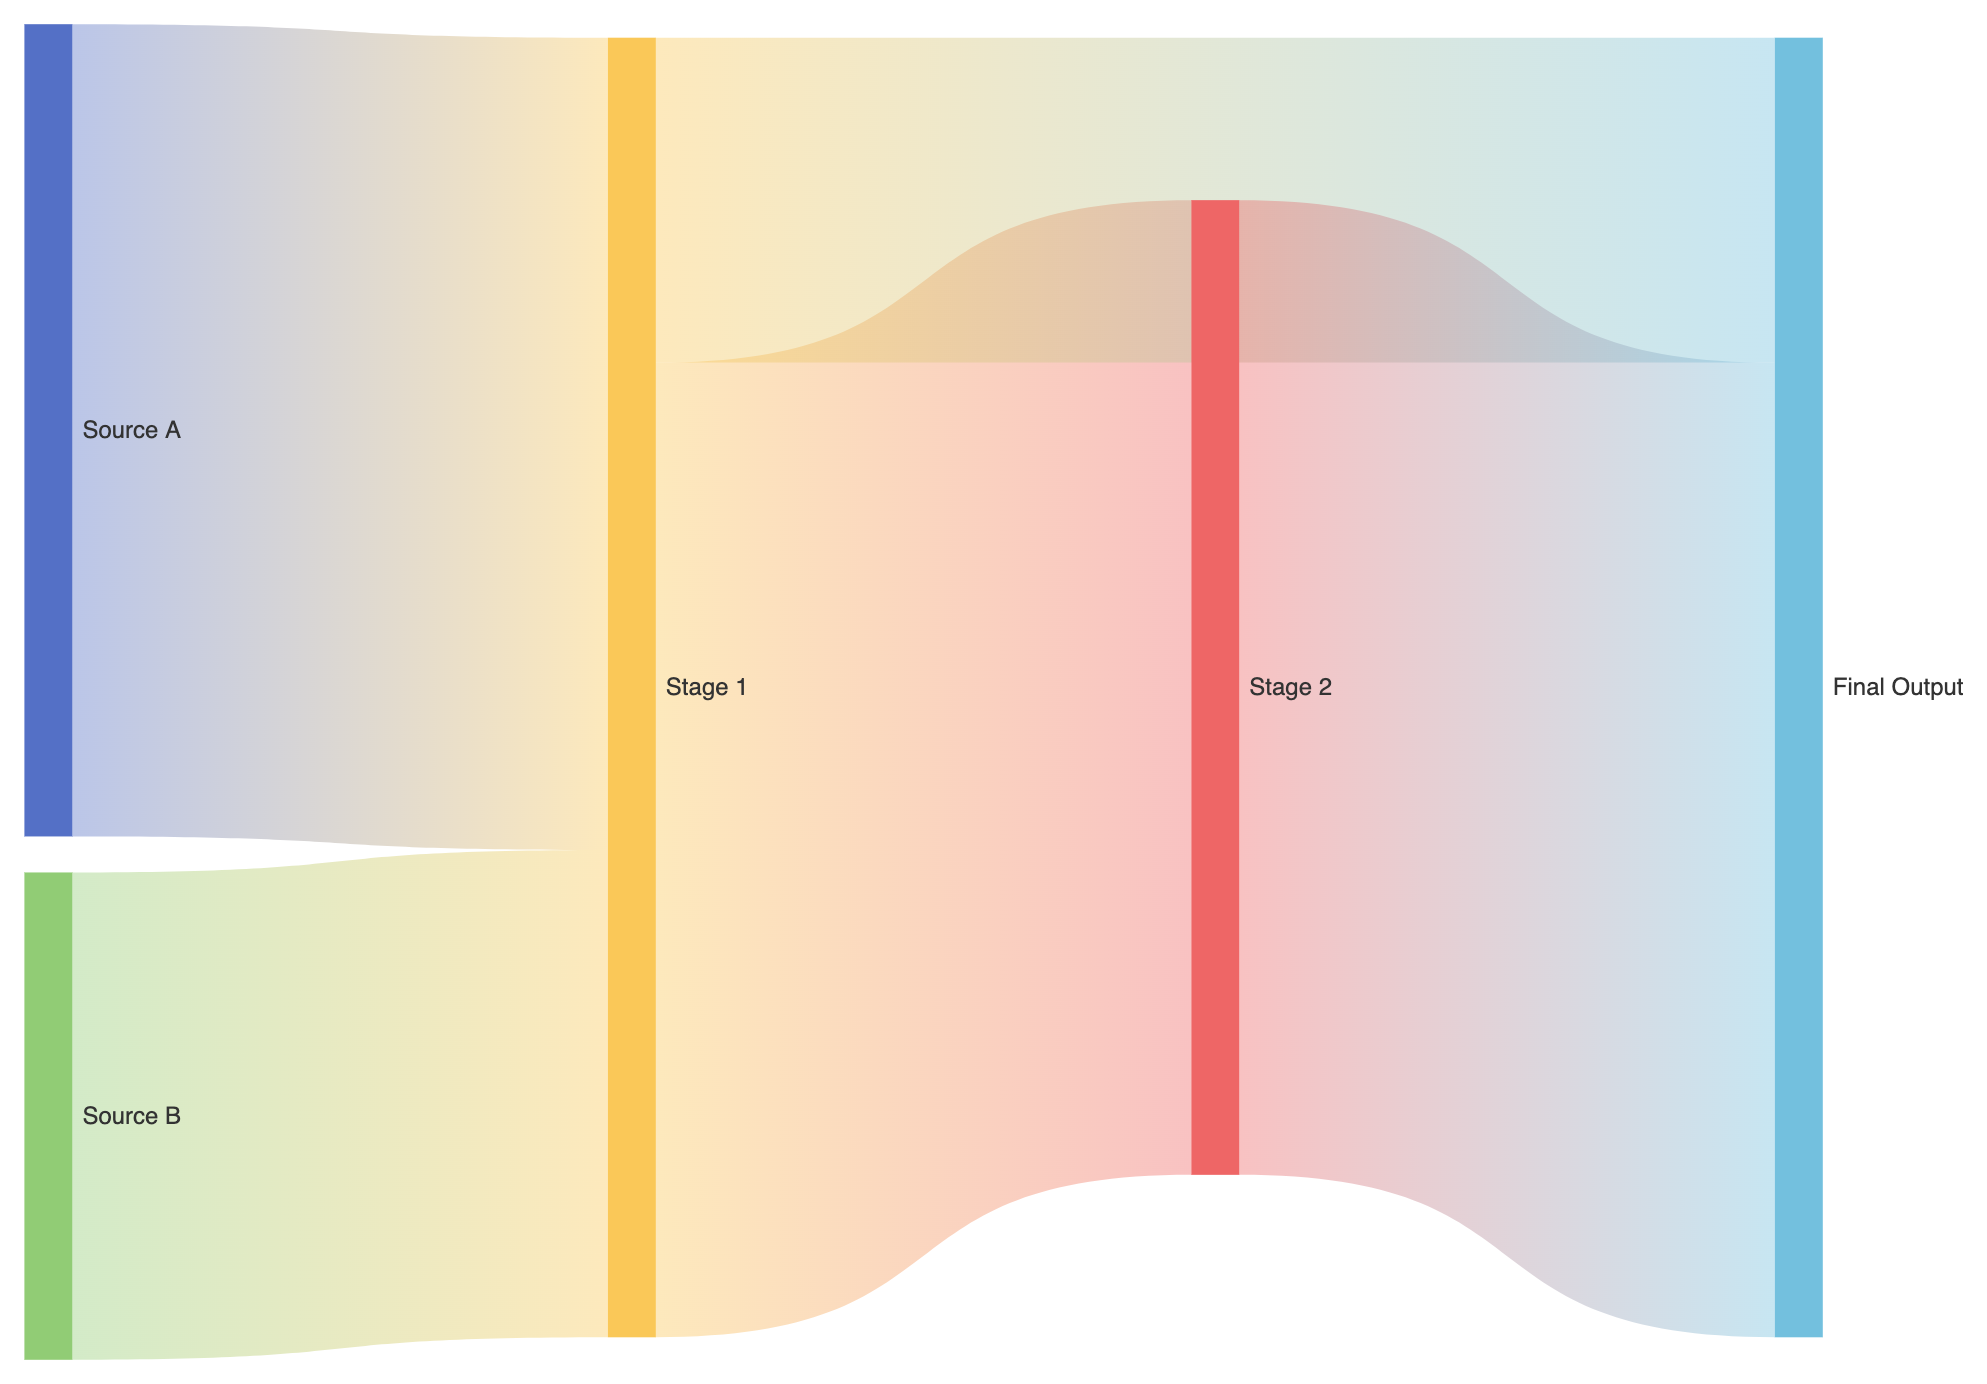
Adjusting node spacing, line curvature, and hover highlight behaviors keeps complex multi-stage flows clean and readable.1. Node Gap Controls and Source-Target Gradient Flows
CustomizingnodeGap and setting lineStyle.color: 'gradient' creates smooth color transitions between stages:
ECharts
Edit ECharts in VPasCode
option = {
    series: [
        {
            type: 'sankey',
            left: '5%',
            right: '15%',
            nodeWidth: 24,
            nodeGap: 18,
            draggable: true,
            label: {
                position: 'right',
                color: '#333',
                fontSize: 12
            },
            data: [
                { name: 'Source A', itemStyle: { color: '#5470c6' } },
                { name: 'Source B', itemStyle: { color: '#91cc75' } },
                { name: 'Stage 1', itemStyle: { color: '#fac858' } },
                { name: 'Stage 2', itemStyle: { color: '#ee6666' } },
                { name: 'Final Output', itemStyle: { color: '#73c0de' } }
            ],
            links: [
                { source: 'Source A', target: 'Stage 1', value: 50 },
                { source: 'Source B', target: 'Stage 1', value: 30 },
                { source: 'Stage 1', target: 'Stage 2', value: 60 },
                { source: 'Stage 1', target: 'Final Output', value: 20 },
                { source: 'Stage 2', target: 'Final Output', value: 60 }
            ],
            lineStyle: {
                color: 'gradient',
                curveness: 0.6,
                opacity: 0.4
            }
        }
    ]
};
Strategic Best Practices
- Maintain Conservation of Flow: Ensure the sum of values flowing into a node equals or logically accounts for the outgoing values to prevent misleading visual gaps.
- Enable
emphasis.focus: 'adjacency': When dealing with multi-stage flows, focusing on adjacent links on hover allows users to isolate specific pathways without visual noise. - Use Gradient Links: Setting
lineStyle.color: 'gradient'smoothly blends the source node color into the target node color, making multi-stage transitions visually intuitive.