


The Mechanics of Tree Charts
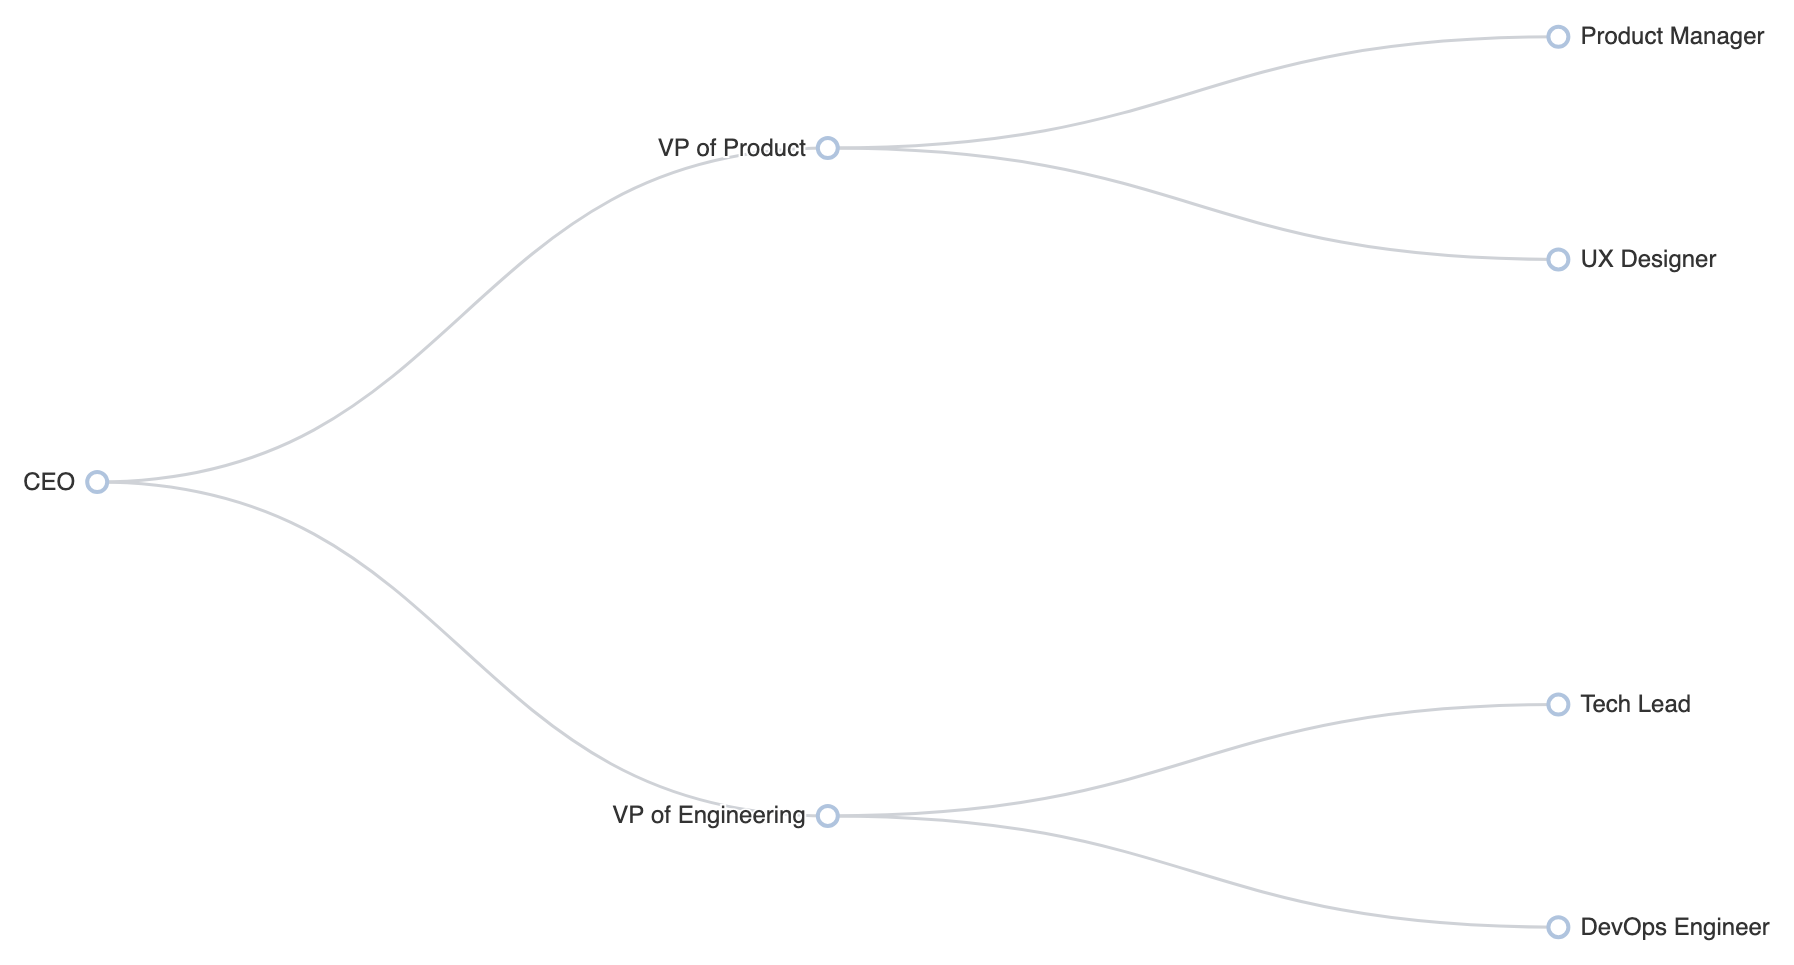
In Apache ECharts, tree charts usetype: 'tree'. Unlike standard charts with explicit X and Y axes, tree charts construct layout positions automatically from a nested JavaScript object containing a name and an optional children array.
1. Essential Setup
To construct a basic tree chart, define your nested data structure and settype: 'tree' inside the series array:
ECharts
Edit ECharts in VPasCode
option = {
    tooltip: {
        trigger: 'item',
        triggerOn: 'mousemove'
    },
    series: [
        {
            type: 'tree',
            data: [{
                name: 'CEO',
                children: [
                    {
                        name: 'VP of Product',
                        children: [
                            { name: 'Product Manager' },
                            { name: 'UX Designer' }
                        ]
                    },
                    {
                        name: 'VP of Engineering',
                        children: [
                            { name: 'Tech Lead' },
                            { name: 'DevOps Engineer' }
                        ]
                    }
                ]
            }],
            top: '5%',
            left: '15%',
            bottom: '5%',
            right: '20%',
            symbolSize: 10,
            label: {
                position: 'left',
                verticalAlign: 'middle',
                align: 'right',
                fontSize: 12
            },
            leaves: {
                label: {
                    position: 'right',
                    verticalAlign: 'middle',
                    align: 'left'
                }
            },
            expandAndCollapse: true,
            animationDurationUpdate: 750
        }
    ]
};
Advanced Layout Orientations
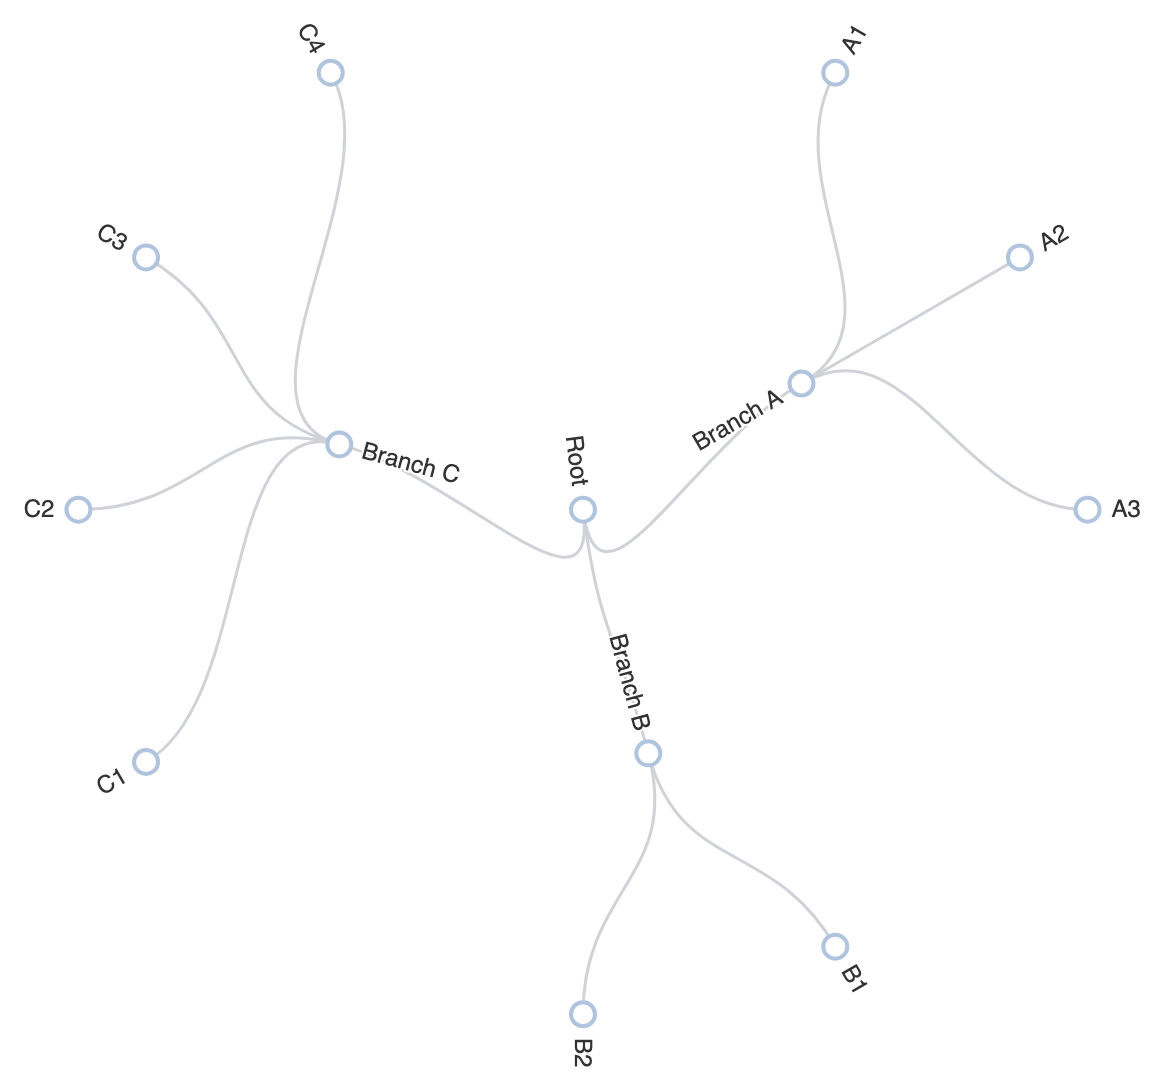
Tree charts can adapt to different space constraints and design requirements by changing their layout direction or switching to a radial display.1. Radial Tree Layout
Setlayout: 'radial' to project branches outward from a center point, ideal for wide hierarchies with many leaf nodes:
ECharts
Edit ECharts in VPasCode
option = {
    tooltip: {
        trigger: 'item',
        triggerOn: 'mousemove'
    },
    series: [
        {
            type: 'tree',
            layout: 'radial',
            data: [{
                name: 'Root',
                children: [
                    {
                        name: 'Branch A',
                        children: [
                            { name: 'A1' },
                            { name: 'A2' },
                            { name: 'A3' }
                        ]
                    },
                    {
                        name: 'Branch B',
                        children: [
                            { name: 'B1' },
                            { name: 'B2' }
                        ]
                    },
                    {
                        name: 'Branch C',
                        children: [
                            { name: 'C1' },
                            { name: 'C2' },
                            { name: 'C3' },
                            { name: 'C4' }
                        ]
                    }
                ]
            }],
            top: '18%',
            bottom: '14%',
            right: '18%',
            left: '18%',
            symbolSize: 12,
            initialTreeDepth: 2,
            animationDurationUpdate: 750
        }
    ]
};
Fine-Tuning Layout and Styling
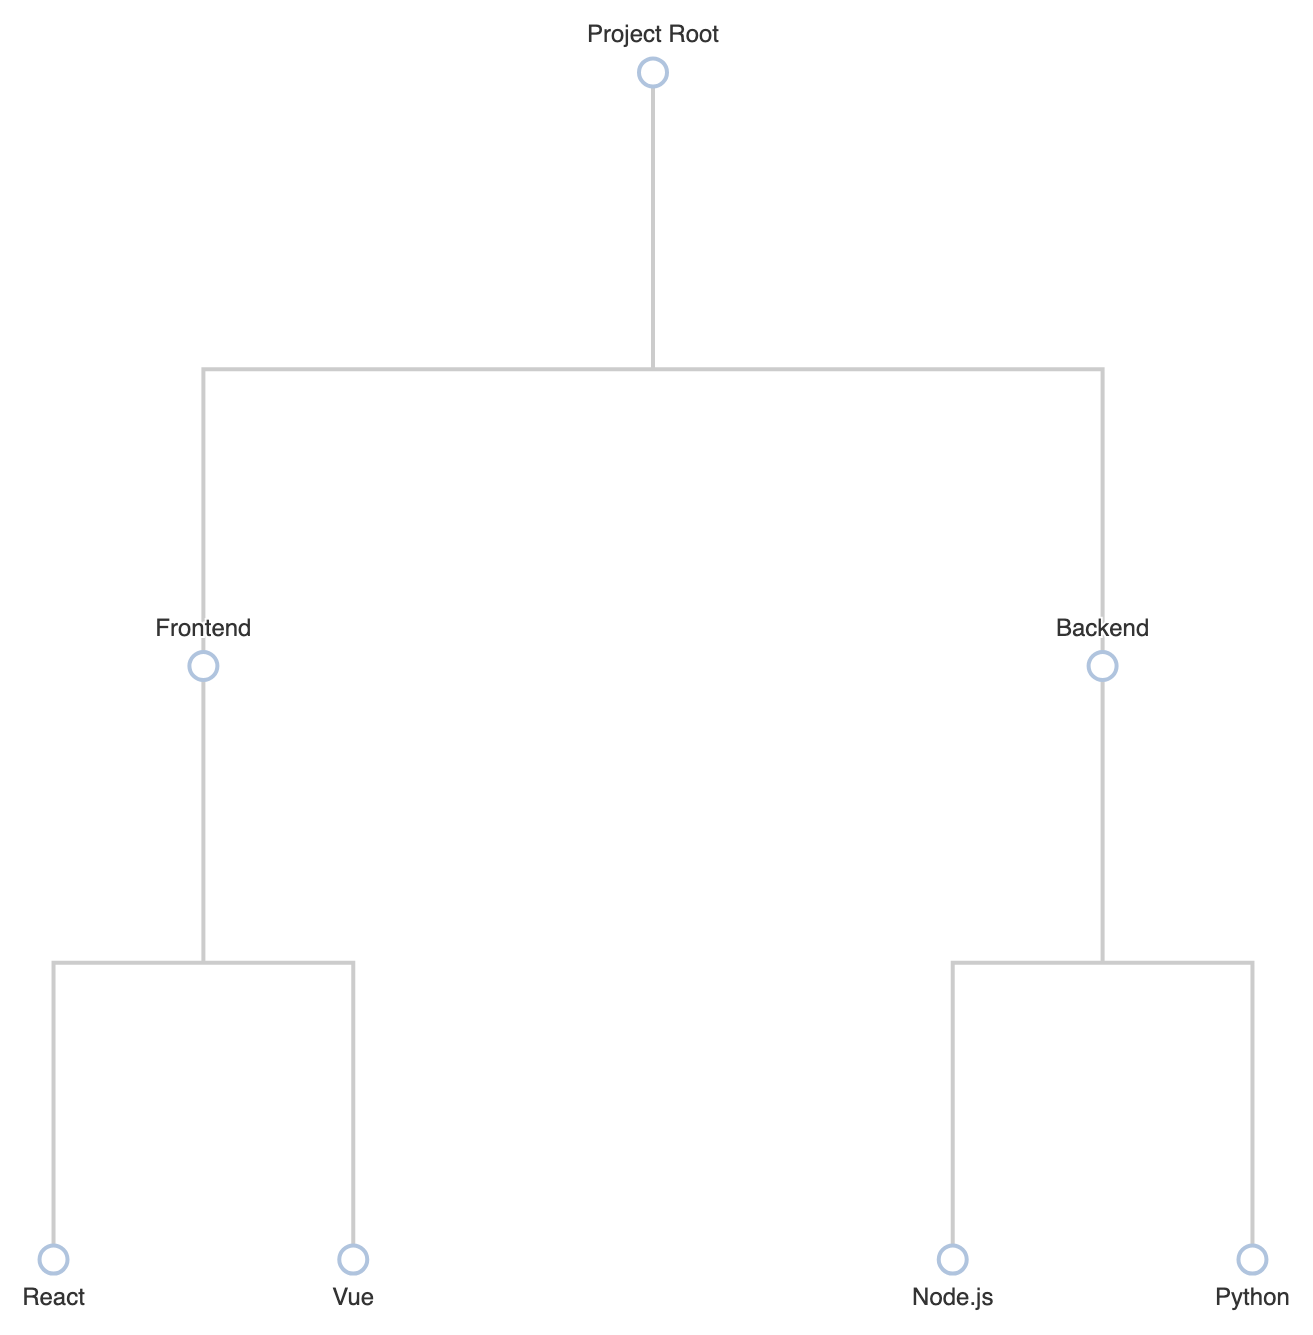
Customizing node symbols, line curves, and level-specific formatting helps highlight key structural tiers across large diagrams.1. Curved Connectors and Level-Based Node Styling
UselineStyle.curveness to smooth connection lines, and define levels array configs to style nodes according to their depth in the hierarchy:
ECharts
Edit ECharts in VPasCode
option = {
    tooltip: {
        trigger: 'item'
    },
    series: [
        {
            type: 'tree',
            orient: 'TB', // Top to Bottom orientation
            data: [{
                name: 'Project Root',
                children: [
                    {
                        name: 'Frontend',
                        children: [
                            { name: 'React' },
                            { name: 'Vue' }
                        ]
                    },
                    {
                        name: 'Backend',
                        children: [
                            { name: 'Node.js' },
                            { name: 'Python' }
                        ]
                    }
                ]
            }],
            top: '10%',
            left: '10%',
            bottom: '10%',
            right: '10%',
            symbol: 'emptyCircle',
            symbolSize: 14,
            edgeShape: 'polyline', // Uses crisp rectangular connections instead of curves
            initialTreeDepth: 2,
            lineStyle: {
                width: 2,
                color: '#ccc'
            },
            label: {
                position: 'top',
                fontSize: 12
            },
            leaves: {
                label: {
                    position: 'bottom'
                }
            }
        }
    ]
};
Strategic Best Practices
- Control Initial Collapse Depth: Set
initialTreeDepth(e.g.,1or2) on large datasets to keep the chart clean on initial load while letting users click nodes to expand details. - Choose the Right Orientation: Use horizontal (`LR`) or radial (`radial`) layouts for deep nested structures with long label text, and vertical (`TB`) layouts for shallow, wide org structures.
- Differentiate Leaf Nodes: Use the
leavesproperty to style end-nodes differently from parent container nodes so users can easily distinguish branches from endpoints.