What is a Gantt Chart?
A Gantt Chart is a staple project management timeline diagram that illustrates project schedules, task durations, start and end dates, critical path dependencies, and resource allocations. It provides a clear visual overview of project progress and task sequencing over time. With VPasCode, you can write concise PlantUML text scripts to build publication-ready Gantt Charts automatically. This eliminates manual timeline bar dragging and spreadsheet formatting while keeping project schedules versionable alongside code and documentation.Core Syntax Guide: Elements and Constructs
Building a Gantt Chart in VPasCode uses task statements, duration definitions, and timeline anchors wrapped inside standard@startgantt and @endgantt block boundaries.
1. Defining Project Dates and Tasks
Set a project start date usingProject starts YYYY-MM-DD. Define tasks by specifying their name and duration in days or weeks:
PlantUML
Edit PlantUML in VPasCode
@startgantt
Project starts 2026-10-01

[Requirements Gathering] lasts 10 days
[System Architecture Design] lasts 15 days
@endgantt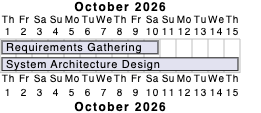
2. Modeling Task Dependencies
Connect tasks sequentially to show prerequisites using thestarts at [Task]'s end dependency statement:
PlantUML
Edit PlantUML in VPasCode
@startgantt
Project starts 2026-10-01

[UX Wireframing] lasts 7 days
[Frontend Development] starts at [UX Wireframing]'s end and lasts 14 days
@endgantt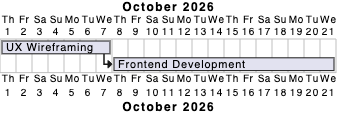
Pro Tip: You can also use shorthand arrows (e.g., [Task A] -> [Task B]) to declare sequential dependencies quickly.
3. Adding Milestones and Resource Allocations
Mark critical project checkpoints using thehappens at milestone syntax, and assign team members or resources to specific tasks using on {Resource}:
PlantUML
Edit PlantUML in VPasCode
@startgantt
Project starts 2024-01-01
[Database Migration] lasts 5 days
[Production Go-Live] starts at [Database Migration]'s end
@endgantt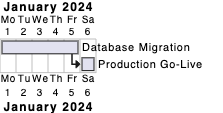
4. Customizing Task Colors and Closed Days
Highlight critical path items with custom task colors and specify unworked weekend days or holidays:
PlantUML
Edit PlantUML in VPasCode
@startgantt
saturday are closed
sunday are closed

[Security Audit] lasts 5 days and is colored in Pink
@endgantt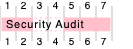
Best Practices for Clean Layouts
- Set Explicit Project Start Dates: Always define
Project starts YYYY-MM-DDto anchor timeline dates accurately. - Group Tasks into Phases: Separate major phases using milestone checkpoints (
happens at) or colored task bars. - Define Non-Working Days: Declare closed weekends or holidays at the top of your script so durations automatically account for workdays.
Real-World PlantUML Gantt Chart Examples
Copy and paste these blueprints directly into your VPasCode editor panel to see them render in real time.Example 1: Software Product Release Timeline
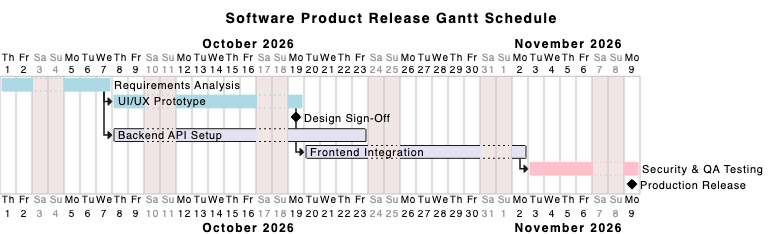
This blueprint models a multi-phase software development schedule from initial discovery through design, development, testing, and production release.
PlantUML
Edit PlantUML in VPasCode
@startgantt
title Software Product Release Gantt Schedule

Project starts 2026-10-01
saturday are closed
sunday are closed

' Discovery & Design
[Requirements Analysis] lasts 5 days
[Requirements Analysis] is colored in LightBlue
[UI/UX Prototype] starts at [Requirements Analysis]'s end
[UI/UX Prototype] lasts 8 days
[UI/UX Prototype] is colored in LightBlue
[Design Sign-Off] happens at [UI/UX Prototype]'s end

' Engineering Phase
[Backend API Setup] starts at [Requirements Analysis]'s end
[Backend API Setup] lasts 12 days
[Frontend Integration] starts at [UI/UX Prototype]'s end
[Frontend Integration] lasts 10 days

' Quality Assurance
[Security & QA Testing] starts at [Frontend Integration]'s end
[Security & QA Testing] lasts 5 days
[Security & QA Testing] is colored in Pink

' Deployment
[Production Release] happens at [Security & QA Testing]'s end
@endgantt