


1. Core Data Flow Symbols & Notation
Data Flow Diagrams rely on distinct shapes to differentiate between external systems, streaming brokers, processing units, and storage locations. In Graphviz, these are represented using specific DOT node shapes and directed edges (->).
| DFD Component | Graphviz Shape | Visual Treatment | Syntax Example |
|---|---|---|---|
| Input / Source Stream | parallelogram |
Accent border with warm fill | shape=parallelogram, fillcolor="#ffedd5", color="#ea580c" |
| Queue / Message Broker | folder |
Distinct container outline | shape=folder, fillcolor="#e0e7ff", color="#4338ca" |
| Processing Engine | box / ellipse |
High-contrast process node | fillcolor="#fae8ff", color="#a21caf" |
| Storage Sink / Lake | cylinder |
Database/sink fill styling | shape=cylinder, fillcolor="#dcfce7", color="#15803d" |
Graphviz
Edit Graphviz in VPasCode
digraph BasicDFD {
    fontname="Helvetica,Arial,sans-serif"
    rankdir=LR;
    node [fontname="Helvetica,Arial,sans-serif", shape=box, style="filled", color="#0f172a", fillcolor="#f8fafc"]
    edge [color="#334155", fontname="Helvetica,Arial,sans-serif", fontsize=10]

    User     [label="Customer Application Request", shape=parallelogram, fillcolor="#ffedd5", color="#ea580c"]
    Process  [label="Order Ingestion Worker Process", fillcolor="#fae8ff", color="#a21caf"]
    Database [label="Production Orders DB Cluster", shape=cylinder, fillcolor="#dcfce7", color="#15803d"]

    User -> Process [label=" Submit Order Request"];
    Process -> Database [label=" Write Order Record"];
}
2. Labeling Data Flows & Data Items
Data flows represent information in motion. Use edge labels ([label="..."]) to specify what information is being passed between entities, processes, and storage locations.
Graphviz
Edit Graphviz in VPasCode
digraph LabeledFlows {
    fontname="Helvetica,Arial,sans-serif"
    rankdir=LR;
    node [fontname="Helvetica,Arial,sans-serif", shape=box, style="filled", color="#0f172a", fillcolor="#f8fafc"]
    edge [color="#334155", fontname="Helvetica,Arial,sans-serif", fontsize=10]

    Client    [label="Mobile App Client Session", shape=parallelogram, fillcolor="#ffedd5", color="#ea580c"]
    AuthProc  [label="Identity Authentication Service", fillcolor="#fae8ff", color="#a21caf"]
    UserStore [label="Centralized User Credentials Store", shape=cylinder, fillcolor="#dcfce7", color="#15803d"]

    Client -> AuthProc [label=" OAuth Login Request"];
    AuthProc -> UserStore [label=" Query User Profile"];
    UserStore -> AuthProc [label=" Return Hashed Credentials"];
    AuthProc -> Client [label=" Issue Bearer JWT Token"];
}
3. Structuring Vertical & Multi-Tier Pipelines
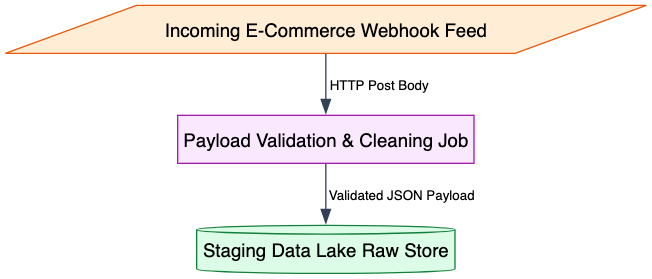
While standard flows use horizontal orientation (rankdir=LR;), vertical arrangements (rankdir=TB;) work exceptionally well for top-down processing, multi-tiered analytics, and ETL pipelines.
Graphviz
Edit Graphviz in VPasCode
digraph VerticalPipeline {
    fontname="Helvetica,Arial,sans-serif"
    rankdir=TB;
    node [fontname="Helvetica,Arial,sans-serif", shape=box, style="filled", color="#0f172a", fillcolor="#f8fafc"]
    edge [color="#334155", fontname="Helvetica,Arial,sans-serif", fontsize=10]

    WebHook  [label="Incoming E-Commerce Webhook Feed", shape=parallelogram, fillcolor="#ffedd5", color="#ea580c"]
    ParseJob [label="Payload Validation & Cleaning Job", fillcolor="#fae8ff", color="#a21caf"]
    RawDB    [label="Staging Data Lake Raw Store", shape=cylinder, fillcolor="#dcfce7", color="#15803d"]

    WebHook -> ParseJob [label=" HTTP Post Body"];
    ParseJob -> RawDB    [label=" Validated JSON Payload"];
}
4. Partitioning System Boundaries (Subgraphs)
To highlight system boundaries, external services, or isolated processing zones, wrap nodes inside DOTsubgraph cluster_* containers.
Graphviz
Edit Graphviz in VPasCode
digraph PartitionedDFD {
    fontname="Helvetica,Arial,sans-serif"
    rankdir=LR;
    node [fontname="Helvetica,Arial,sans-serif", shape=box, style="filled", color="#0f172a", fillcolor="#f8fafc"]
    edge [color="#334155", fontname="Helvetica,Arial,sans-serif", fontsize=10]

    Vendor [label="External Inventory Partner API Feed", shape=parallelogram, fillcolor="#ffedd5", color="#ea580c"]

    subgraph cluster_inventory_boundary {
        label = "Internal Inventory Platform Subsystem";
        style = "dashed";
        color = "#64748b";

        IngestProc [label="Inventory Batch Ingestion Service", fillcolor="#fae8ff", color="#a21caf"]
        CatalogDB  [label="Product Catalog Warehouse Database", shape=cylinder, fillcolor="#dcfce7", color="#15803d"]

        IngestProc -> CatalogDB [label=" Batch Stock Sync"];
    }

    Vendor -> IngestProc [label=" Scheduled XML Payload"];
}
5. Complete Practical Example
The following example demonstrates a multi-tier IoT telemetry pipeline featuring sensor streams, message queue buffers, real-time transformations, cold storage, and operational dashboards.
Graphviz
Edit Graphviz in VPasCode
digraph IoTTelemetryFlow {
    fontname="Helvetica,Arial,sans-serif"
    rankdir=LR;
    node [fontname="Helvetica,Arial,sans-serif", shape=box, style="filled", color="#0f172a", fillcolor="#f8fafc"]
    edge [color="#334155", fontname="Helvetica,Arial,sans-serif", fontsize=10]

    Sensors   [label="Edge IoT Sensor Metric Streams", shape=parallelogram, fillcolor="#ffedd5", color="#ea580c"]
    MQTTQueue [label="Centralized Ingestion Buffer\n(RabbitMQ Queue Cluster)", shape=folder, fillcolor="#e0e7ff", color="#4338ca"]
    StreamWorker [label="Stream Transformation Processor\n(Spark Streaming Cluster)", fillcolor="#fae8ff", color="#a21caf"]
    ColdSink  [label="Historical Metric Archives\n(Google Cloud Storage Sink)", shape=cylinder, fillcolor="#dcfce7", color="#15803d"]

    Sensors      -> MQTTQueue    [label=" Protobuf Payload Ingest"];
    MQTTQueue    -> StreamWorker [label=" Message Queue Consume"];
    StreamWorker -> ColdSink     [label=" Partitioned Parquet Dump"];
}